
+8.9%
Revenue Yoy
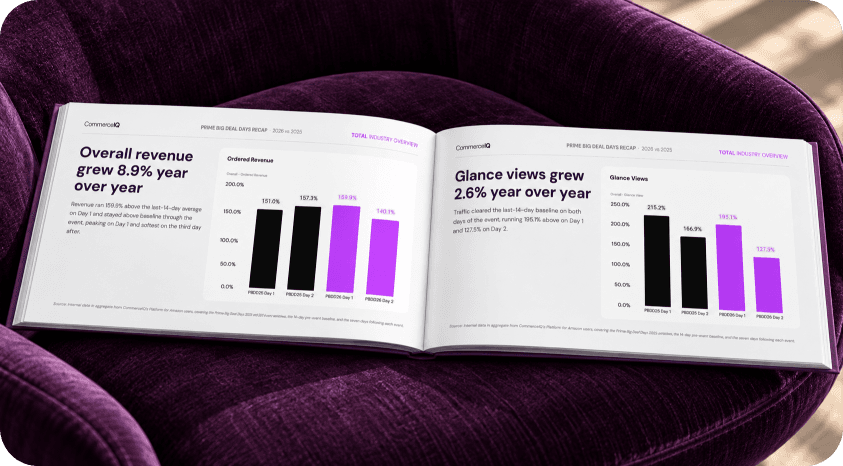
Revenue ran 160% above the last-14-day average on Day 1 and stayed above baseline through the event, peaking on Day 1 and softest on the third day after.
By clicking "Accept all", you agree to storing cookies to enhance navigation, analyze usage, and support marketing. Privacy Policy.
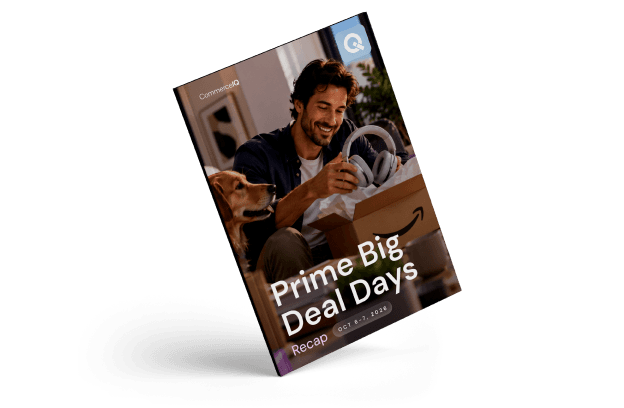
PRIME BIG DEAL DAYS - FULL RECAP
A demand-led Prime Big Deal Days: Revenue grew while brands spent less to win it.
+8.9%
Revenue Yoy
Revenue ran 160% above the last-14-day average on Day 1 and stayed above baseline through the event, peaking on Day 1 and softest on the third day after.
−11.5%
Ad Spend YoY
Advertising investment adopted a leaner media posture, also increasing less vs. L14 as compared to last year.
+5.8%
ROAS YoY
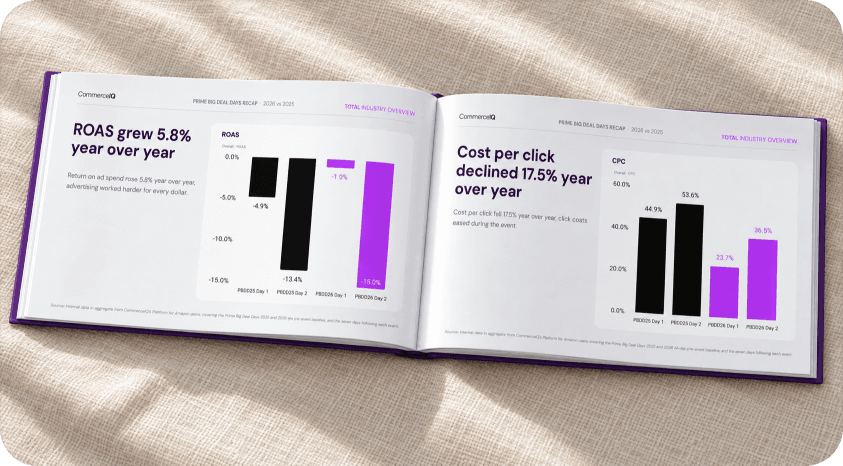
ROAS is negative as it is compared to the L14 average. As ad spend grew significantly and return also grew but less so, the ROAS fraction shows a decrease.


This Full Recap report compares Prime Big Deal Days 2026 vs 2025 across seven categories and multiple ecommerce benchmark metrics.
01
US revenue grew 8.9% year over year even as ad spend fell 11.5%, a sign the event was carried by real demand rather than heavier media.
02
Unit conversion rose 10.8% year over year, the clearest driver of growth, as shoppers who arrived were readier to buy than last year.
03
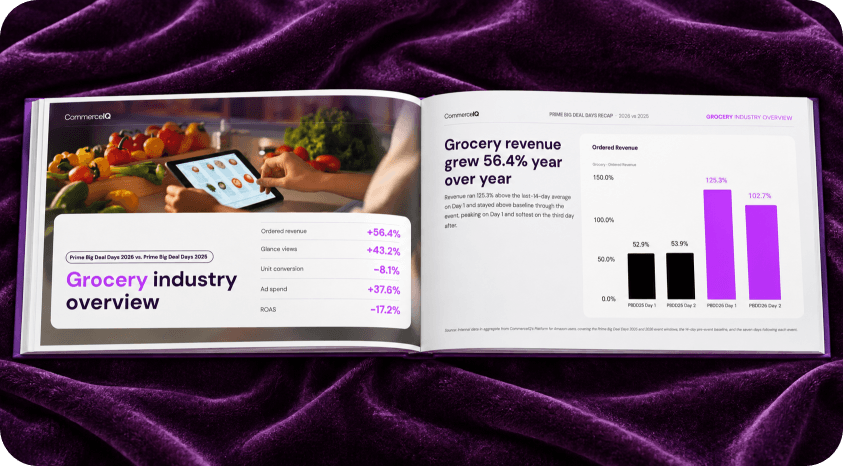
Ordered Revenue during event vs. L14 average varied widely between categories, with Pet growing just 30% and Furniture, Grocery, while beauty reigned w/ 350% growth.
04
Beauty revenue grew 11.4% year over year on an average selling price 36.0% higher and ROAS 76.9% higher, even with lighter traffic.
05
Return on ad spend rose 5.8% year over year while spend fell 11.5%, pointing to more disciplined, better-targeted media across the event.
06
Ad spend fell year over year on the two headline days but rose 5.4% across the seven days after the event, and post-event revenue grew 9.6% year over year. The window still ran below a normal week on the last-14-day baseline, so demand pulled forward into the event, but more brands clearly sustained investment into the days after rather than pulling back as they did last year.